

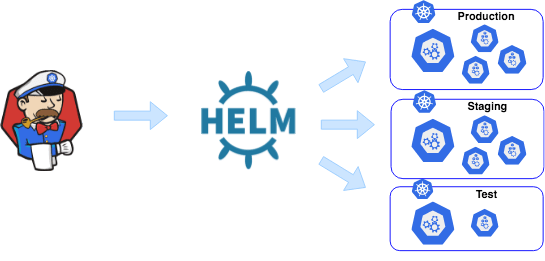
Helm charts are bit complicated when it comes to implementation.In this article I will discuss how to use them efficiently and simple way. I don’t want to explain the helm architecture because you can find enormous document in online .
I explain some important concepts which every helm developers should know . There are few topics are important before jump in to code .
Tiller
Tiller is a server side component which will listen helm commands for deploying pod depends on configuration and take care of your software releases.
Helm Chart
Helm uses a packaging format called charts. A chart is a collection of files that describe a related set of Kubernetes resources. A single chart might be used to deploy something simple, like a application pod, or something complex, like a full web app stack with HTTP servers, databases, caches, and so on
Our first step is to install the Helm chart .Refer the below link for installing the helm chart
To install,
https://helm.sh/docs/intro/install/
Once successfully installed start the helm tiller with below command.Before to that make sure your kubernetes environment is up and running by installing minikube, VirtualMachine (VMware fusion or Virtual Box ) and kubectl.
1 Start the server
helm init
2 Create a chart
helm create mychart
It will create a chart directory with below hierarchy ,
mychart
|-- Chart.yaml
|-- charts
|-- templates
|   |-- NOTES.txt
|   |-- _helpers.tpl
|   |-- deployment.yaml
|   |-- ingress.yaml
|   `-- service.yaml
`-- values.yaml
3 Verify the chart
Once you fill your chart with your required details then debug the chart with below command .Will discuss deployment details later .
helm install –dry-run –debug my-chart
This will list the deployment with release name and other details.
4 Install the chart
helm install my-chart
5 Verify the deployment
helm list
list the deployment details with release name.
6 Delete the chart
helm delete –purge
—purge – The above command removes all the Kubernetes components that are associated with the chart and deletes the release.
Mostly we use above 5 commands for creating the charts .
Will Continue …..
